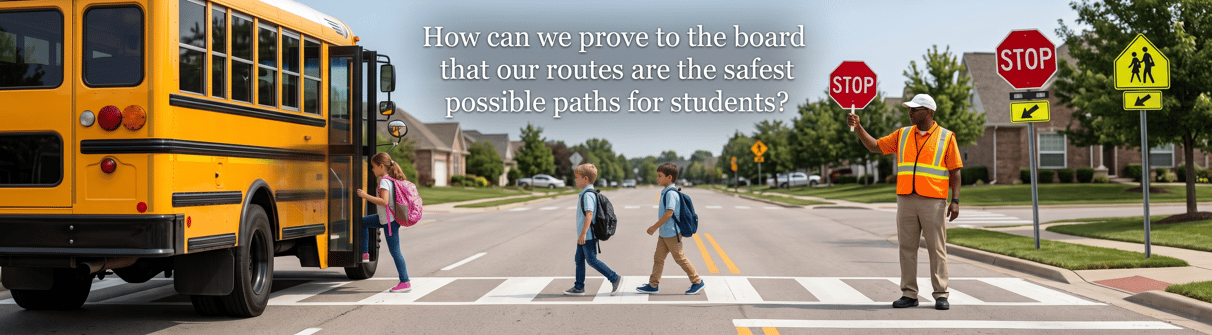
If you’ve ever sat in a school board meeting, you know the feeling. The lights are bright, the room is quiet, and all eyes are on you. You’ve presented your budget, explained the school bus driver shortage, and now comes the big question, “How do we know these routes are actually safe?”
As a Transportation Director, you know in your gut that your team is doing everything right. You spend hours pouring over maps and adjusting schedules. But "trust me" doesn't always fly with a board focused on liability, budgets, and, most importantly, student welfare.
To win them over, you need to move from anecdotal evidence to hard, cold data. You need to prove that your routes aren't just efficient, they are the safest possible paths for every child in the district. Here’s how you can use BusBoss and data-driven reporting to make your case bulletproof.
Board members love data, but they love visual data even more. When you tell them a route is safe, they see a line on a map. When you show them a safety audit report that highlights avoided hazards, they see a commitment to excellence.
Proving safety starts with having a centralized "source of truth." If your routing information is scattered across spreadsheets and paper maps, you’re already at a disadvantage. By using a transportation routing software system, you can generate reports that quantify safety in ways that are easy for non-transportation professionals to understand.
It’s a well known fact in the industry, left-hand turns are significantly more dangerous than right-hand turns. In fact, research shows that left turns are a leading pre-crash event in roughly 22% of all traffic accidents.
When you present to the board, show them the "Right-Turn Logic" built into your routing. With BusBoss, you can demonstrate how the software automatically prioritizes right-hand turns to minimize the time a bus spends idling in the middle of an intersection or crossing oncoming traffic.
What to show the board:
The National Highway Traffic Safety Administration (NHTSA) promotes a "Safe System" approach that focuses on redundancy in safety. You can tell your board that your department isn't just "winging it", you are following federal frameworks.
Use your software to document Stop-Site Hazard Analyses. This involves evaluating every bus stop for:
By maintaining these records digitally, you can pull a report for any specific stop in the district within seconds. This level of transparency builds immense trust with both the board and the community. For more on this, check out our 4 tips to using route software to maximize these features.
Safety isn't just about the route on paper; it’s about how that route is driven in the real world. This is where GPS integration becomes your best friend.
If a parent calls the board claiming a driver is speeding or taking "shortcuts" through dangerous neighborhoods, you shouldn't have to guess what happened. You can pull up an audit trail that shows the exact path the bus took, the speed at which it traveled, and every stop it made.
Proving to the board that you have real-time oversight of your fleet demonstrates that you are proactive, not reactive. You can also use this data to create safe driving incentives, showing the board that you are investing in the "human element" of safety as much as the technology.
When discussing safety, the board is often particularly concerned with Special Education transportation. These routes require a higher level of detail, including specialized equipment tracking and specific student needs documentation.
Using inclusive solutions like BusBoss for Special Education allows you to prove that you are meeting IDEA requirements while maintaining the highest safety standards. You can show the board that your routing software accounts for wheelchair lift requirements, nurse assignments, and climate-controlled environments, ensuring that the safest path is also the most medically appropriate one.
Often, the "danger" perceived by parents and board members comes from a lack of information. If a parent doesn't know where the bus is, they assume the worst.
By implementing parent portals and tracking apps, you can reduce the number of calls to the district office and provide parents with peace of mind. When you show the board the high adoption rates of these tools, you are proving that your safety measures are reaching the people who care most, the families. We've discussed why communication between parents and transportation is a cornerstone of a safe district environment.
Ready for your next board meeting? Here is a quick checklist of what to bring to prove your routes are the safest:
Proving route safety to a school board isn't about having the loudest voice; it’s about having the clearest data. By using the reporting and optimization tools within BusBoss, you can transform a complex web of streets and stops into a documented, high-security network.
You aren't just moving students from point A to point B. You are managing a sophisticated safety operation. When you show the board the logic, the audits, and the real-time tracking that goes into every single mile, the question shifts from "Is it safe?" to "How did we ever do this without these tools?"
Are you ready to turn your routing data into a powerful safety narrative? We’ve helped hundreds of districts prove their value and protect their students.
Schedule a BusBoss Demo Today and see exactly how our reporting tools can make your next board meeting your most successful one yet. You can also explore our case studies to see how other districts have revolutionized their transportation safety.


 Orbit Software, Inc.
424 King Street
Pottstown, PA 19464
 (484) 941-0820